
Revised on March 11, 2019, with new analysis reported after the original post.
Often on Twitter I encounter people I’ve come to think of as IQ truthers. IQ is the magic social science variable that explains virtually every observed correlation. Racial differences? The intergenerational transmission of wealth? The effects of parenting or family structure? All of it must boil down to differences in IQ.
As a social scientist I’m naturally resistant to single-variable theories. The world is just too complex for that. But it’s much more persuasive for me to respond with data. I was motivated to do so when I realized I had the appropriate national data at hand, the 1979 cohort of the National Longitudinal Survey of Youth. This is a representative sample of over 10,000 Americans between the ages of 14 and 22 initially interviewed in 1979, then annually or biennially thereafter. My subset ends at 2014. My NLSY79 research is looking at the economics of motherhood, so my analytic sample is limited to men and women with kids (hey, this is a blog post, not a peer-reviewed article). This leaves me with a sample size of about 7,100, more than enough for population estimates.
Early on in the panel respondents were administered a variety of IQ tests, as well as the similar Armed Forces Qualifying Test. Only about 1,700 respondents got the IQ tests, while all were given the AFQT. AFQT and IQ measure essentially the same things, and are highly correlated (r = .78). Accordingly I’ll report results based on AFQT scores. Analysis based on IQ produced essentially the same results.
My existing research looks at family income, so I’ll go with it as the dependent variable here. It’s top-coded at $300,000, logged for all regression analyses, and converted into 2018 dollars to account for inflation.
Do higher AFQT scores predict a higher income? Of course they do, as this graphic shows:

But a lot of other things also predict income. What’s the unique contribution of AFQT scores? More precisely, how much of the variability in income can they explain? Statisticians often answer this question by reporting a statistic called r-squared that varies from zero to one. In this analysis, zero means AFQT has no predictive power, while one would mean that someone’s income can be perfectly predicted by knowing their AFQT score. An r-squared of .5 would mean that halff the variation in income could be explained by knowing someone’s AFQT scores (or, less scientifically, half the time you can predict someone’s income by knowing how they did on the AFQT).
Skip over this paragraph if you’re not interested in statistics. I estimated a series of random-effects regression models using the NLSY79 data. Hausman tests suggest that fixed-effects fit the data better, but don’t allow me to explore fundamentally time-invariant predictors like AFQT scores (in any event, they were only administered once to respondents). My dependent variable is the natural logarithm of inflation-adjusted family income. In addition, I repeated my analyses using OLS regression to predict log-median income across survey waves and obtained similar results.
The data show that AFQT scores explain 21 percent of the variation in income between survey respondents. That’s not nothing, but it’s not a whole lot either. Many things determine how much money people make, and smarts is only one of them.
In fact, the true contribution of AFQT to income is probably even smaller. That’s because AFQT is serving as a proxy for other attributes correlated with earnings. People with high AFQT scores probably stayed in school longer, and most likely had more successful parents. These and other correlates of intelligence factor into the aforementioned 21 percent.
To look at this I estimated two additional regression models. One of them included a bevy of independent variables, all things social scientists generally use to predict income. Many of these attributes are measured at each survey wave: marital status and presence of a live-in partner, education, number of children, employment status, employment history, hours worked, and age. Measures of race/ethnicity and sex are also included.
Together all these variables predict 48 percent of the variation in income between respondents. Adding AFQT scores bumps that number up to 50 percent. In other words, after accounting for the usual demographic suspects, AFQT only accounts for 2 percent of the variation in income. The unique contribution of native intelligence appears to be small.
Some caveats. My data are nationally representative, but it’s a sample of parents, not all Americans. Childless Americans are excluded. Most of the respondents are now in their 50s. Perhaps the influence of intelligence on earnings has changed over time. I’m also looking at family income rather than individual income. Family income is more important than individual income for determining quality of life. That having been said, I don’t expect it to matter much. Smarter people make more money; when married, their spouses make more money. The differences will wash out in a large sample like mine.
Does IQ affect income, and other measures of human accomplishment? It does—but so too do a lot of other things. The foregoing results suggest intelligence is not the cardinal social science variable, or to paraphrase Tolkien: It’s not the one variable to rule them all, one variable to find them, one variable to bring them all and in the darkness bind them.
Updated March 11, 2019
I thank the Twitterverse for the many useful comments I received on my original blog post, with special thanks to Lee Jussim, Alex Tabarrok, Robert VerBruggen, and Garett Jones. Needless to say, any errors in this update are mine alone.
Lee pointed out with a correlation coefficient of .46 (the square root of the r squared I initially reported, .21), the effect of intelligence on earnings rivals the largest observed effects in all of social psychology (which is Lee’s field). This is an entirely reasonable observation. In retrospect, I oversold the underselling of IQ: my intention was not to aver that it predicts nothing, but to show that it doesn’t predict everything. Most reasonable people would have agreed all along, of course. Instead, my intention was to have some ready data to respond to the intelligence truthers.
Robert wanted to know about effect sizes. Metric coefficients showing changes in log-income don’t mean much to the human eye, so I prepared some predicted probabilities based on a regression standardization of my aforementioned random-effects models. AFQT is converted into deciles for this analysis.
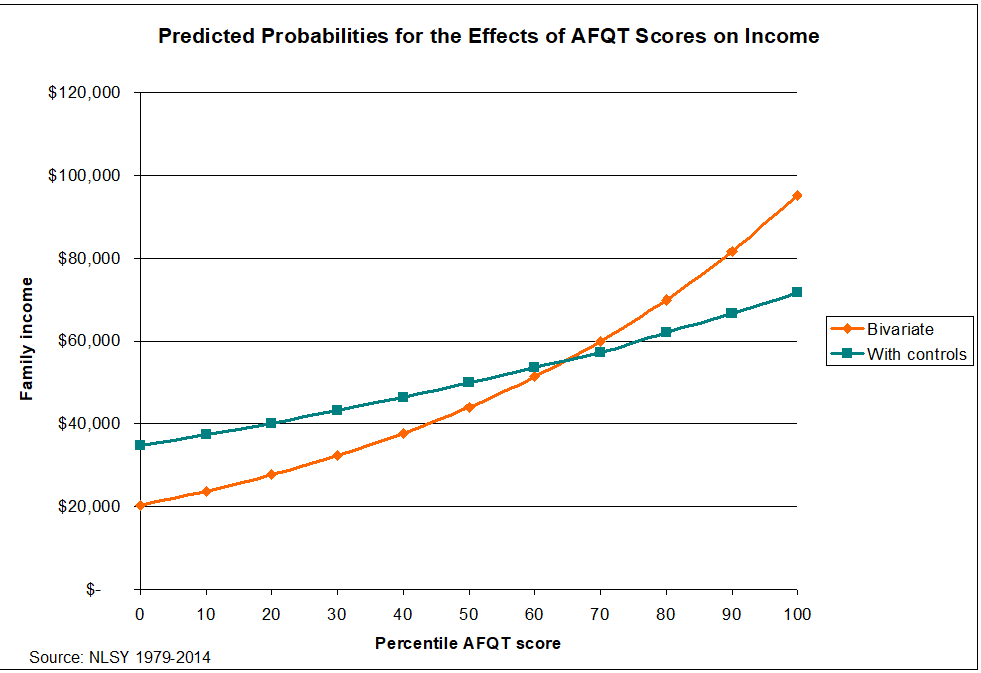
As is obvious from the graph, smarter people on average have higher incomes. This is especially apparent from the bivariate model, which contains only AFQT and income.
This is the model we should be paying attention to, per the comments of Alex and Garett. They note, correctly, that there are a lot of endogeneity problems with the multivariate model I originally presented. In plain English: education, marital status, and the like are all downstream of income. AFQT might influence income directly, or indirectly (for example, smarter people are more likely to stay in school, which in turn affects income).
Can this proposition be tested empirically? It can, if we’re willing to make some assumptions. For instance, if we reasonably assume AFQT is anterior to education and education is anterior to income, we can explore AFQT’s direct and indirect effects—as mediated by education—on income via path analysis (the people who want latent variables in their path analysis are asking for better measurement of IQ than is available in my data). I also have nothing to offer to anyone seeking unicorns of model identification.
I’ll limit the demonstration to the role of education in explaining the effects of IQ on income (I’m sympathetic to the allegations of bloat concerning my initial multivariate model). The point of this blog post is to show that IQ is just one of many variables that matter in explaining the world; it’s not to conduct an exhaustive exploration of the predictors of income, nor to identify the extent to which all measured variables at my disposal can mediate the effects of IQ. Education is a good place to start: it has real-world significance, and a noteworthy correlation with earnings.
The results of the regressions composing the path analysis (and more!) look like this:
| B | β | |||
| AFQT → income | 0.013 | 0.505 | ||
| AFQT → education | 0.022 | 0.606 | ||
| Education → income | 0.340 | 0.470 | ||
| Education → income (partial) | 0.190 | 0.345 | ||
| AFQT → income (partial) | 0.009 | 0.265 | ||
| AFQT → income (indirect) | 0.007 | 0.237 | ||
Non-stats people should skip all this→ These estimates were obtained via OLS, as described above. I converted education into a continuous variable to facilitate interpretation. All effects are statistically significant (p < .001) based on Huber-White standard errors. I’m generally opposed to standardized coefficients (the βs), but they’re useful here.
The total effect of AFQT on income (.505) can be decomposed into partial (.265) and indirect (.237) effects (in a world without rounding error, .265 and .237 would sum to .505, the zero-order effect). The partial effect of AFQT (.265) reflects the extent to which it affects income net of differences in educational attainment The indirect effect (.237) represents the extent to which AFQT increases income by increasing education. The partial effect of education (.345) reflects the extent to which education affects income net of AFQT. It’s not rocket surgery to observe that both AFQT and education have large partial effects on income. Indeed, the partial effect of education (.345) is larger than that of AFQT (.265), although the overall effect of AFQT is larger once we factor in its indirect effect (i.e., smarter people are more likely to attend college, so they ultimately make more money).
The revised upshot of this blog post: sure, IQ matters. But other stuff matters too.